Step by step monitoring of the ExpressRoute Circuit with Network Performance Monitor – Part I
As many of you know that Azure ExpressRoute let us to extend our on-premises infrastructure to Azure Cloud over a private dedicated connection. With ExpressRoute, you can establish connections to Microsoft Azure Network.
If you are from the Azure pre sales background or an Azure Architect like myself, you must be aware that in most of the solution/design we generally recommend our customers to use the Azure ExpressRoute circuit to connect their on-premises environment to Azure, however post-deployment there are many challenges customers may face like they may not be able to utilize the complete network bandwidth, latency related issue, slowness and many more.
A below network utilization is an example of such a scenario where although the customer has purchased 500 Mbps pipe but it’s underutilized. So the monitoring of the express route circuit will really become very important post-deployment.
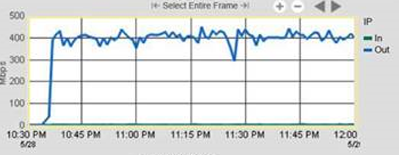
Fig: Express route utilization.
And the best way to monitor the express route circuit is to deploy the NPM from Azure Market Place.
A diagram of a typical ExpressRoute Circuit is shown below.
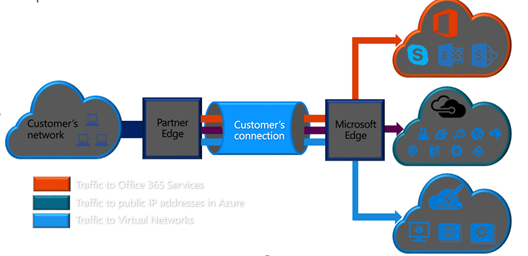
Fig: Express Route Circuit.
The main advantage of ExpressRoute Circuit is that they don’t go over the public Internet. This lets ExpressRoute connections offer more reliability, faster speeds, lower latencies, and higher security than typical connections over the Internet.
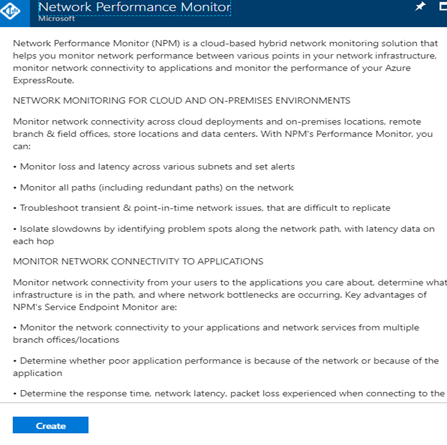
Network Performance Monitor (NPM) is a cloud-based hybrid network monitoring solution that helps you monitor network performance between various points in your network infrastructure, monitor network connectivity to applications and monitor the performance of your Azure ExpressRoute.
As per Microsoft the NPM can do the following things.
NETWORK MONITORING FOR CLOUD AND ON-PREMISES ENVIRONMENTS
Monitor network connectivity across cloud deployments and on-premises locations, remote branch & field offices, store locations and data centers. With NPM’s Performance Monitor, you can:
• Monitor loss and latency across various subnet and set alerts
• Monitor all paths (including redundant paths) on the network
• Troubleshoot transient & point-in-time network issues, which are difficult to replicate
• Isolate slowdowns by identifying problem spots along the network path, with latency data on each hop
MONITOR NETWORK CONNECTIVITY TO APPLICATIONS
Monitor network connectivity from your users to the applications you care about, determine what infrastructure is in the path, and where network bottlenecks are occurring. Key advantages of NPM’s Service Endpoint Monitor are:
• Monitor the network connectivity to your applications and network services from multiple branch offices/locations
• Determine whether poor application performance is because of the network or because of the application
To monitor the expressroute circuit first you need to install and configure the Azure Network Performance Monitor.
First go to the Azure Market Place and Search for Network Performance Monitor
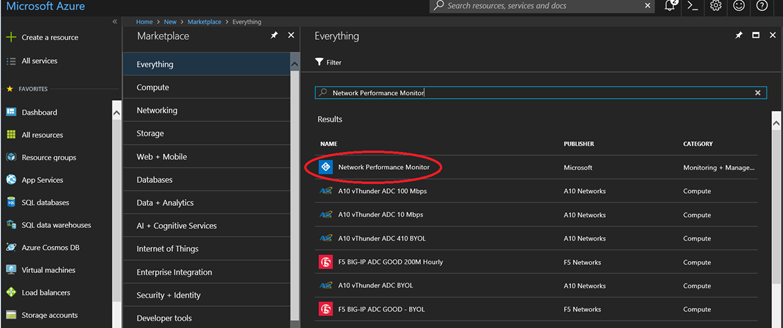
Click on the network performance monitor and click on create button
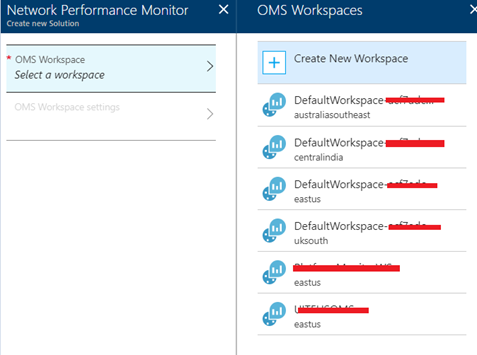
In the next step you need to choose an OMS workspace.
* OMS is operations management suite.
Please note that at time while I am writing this blog post you can monitor ExpressRoute circuits in any part of the world by using a workspace that is hosted in one of the following regions:
- West Europe
- West Central US
- East US
- South East Asia
- South East Australia
Also don’t think that you can’t monitor the express route of the other regions, these above regions I am only talking about the workspace location and it has nothing to do with Express Route Monitoring between other regions.
I have a workspace created in East US which is I am choosing now.
Since I have already OMS workspace created so I have linked the existing OMS workspace.
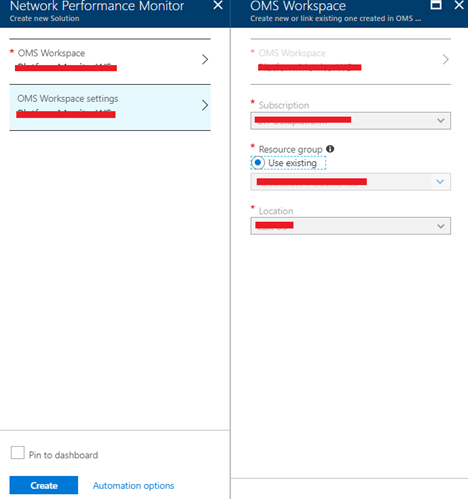
In the next step it will submit the deployment.
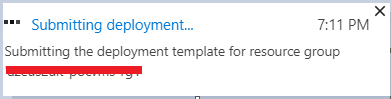
In the next step you can see that the deployment is successful.
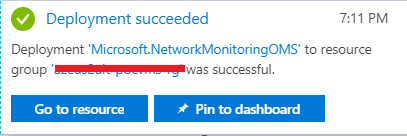
In the last screen you can view the NPM solution which is just deployed in East US
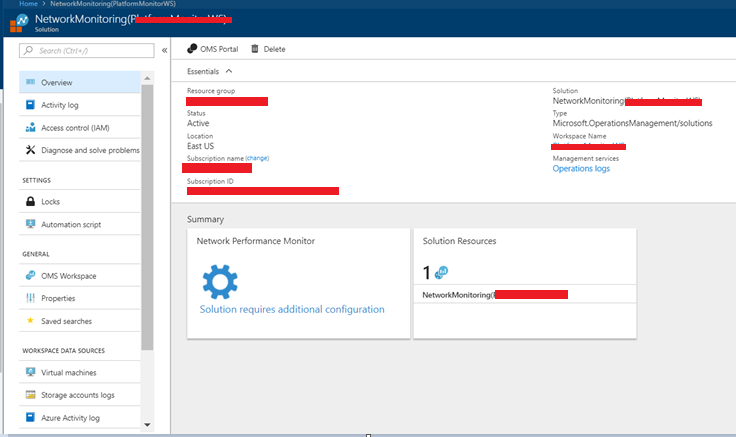
After the Workspace has been deployed, navigate to the NetworkMonitoring(name) resource that we created. Validate the settings, then click Solution requires additional configuration.
The next step is to download and configure the agent setup file.
Go to the Common Settings tab of the Network Performance Monitor Configuration page for your resource. Click the agent that corresponds to your server’s processor from the Install OMS Agents section and download the setup file.
Next, copy the Workspace ID and Primary Key to Notepad.
From the Configure OMS Agents for monitoring using TCP protocol section, download the Powershell Script. This Firewall Script will add rules in the Windows Firewall.
The agent must be installed on a Windows Server (2008 SP1 or later)
I have choose to install it on a Windows 2008 R2 computer. This is a on premises server which is a database server for Oracle.
Here are the steps to install the NPM agent on the server.
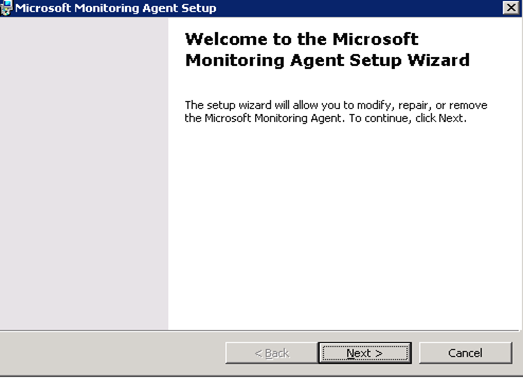
First step is to run the setup once you click on the setup you will see the following screen.
On the welcome page click on next
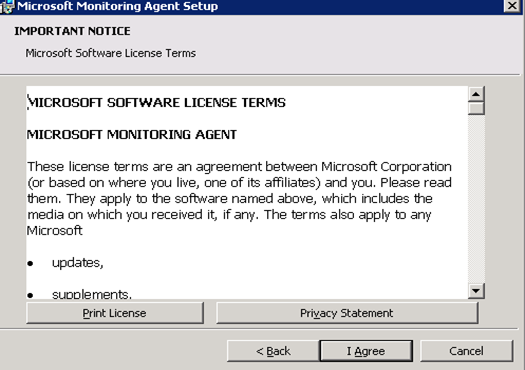
On the License Terms page, read the license, and then click I Agree.
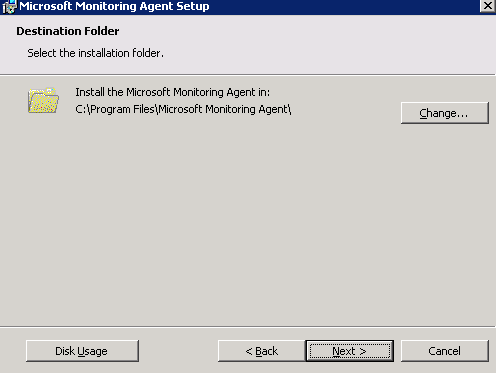
On the Destination Folder page, change or keep the default installation folder, and then click Next.
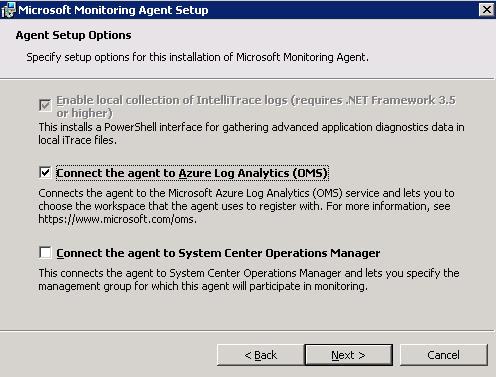
On the Agent Setup Options page, you can choose to connect the agent to Azure Log Analytics or Operations Manager. Or, you can leave the choices blank if you want to configure the agent later. After making your selection(s), click Next.
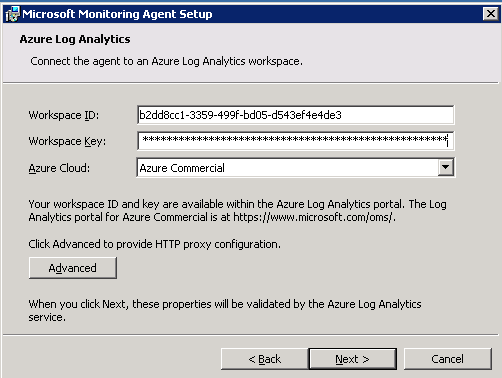
If you chose to connect to Azure Log Analytics, paste the Workspace ID and Workspace Key(Primary Key) that you copied into Notepad in the previous section. Then, click Next.
On the Agent Action Account page, choose either the Local System account, or Domain or Local Computer Account. Then, click Next.
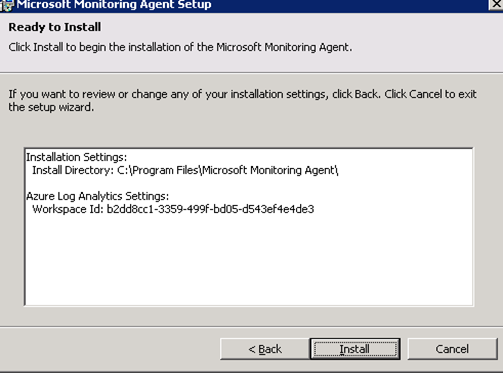
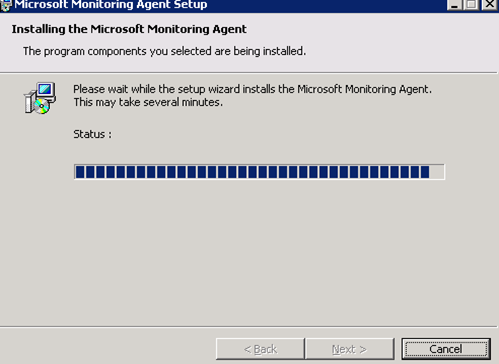
On the Ready to Install page, review your choices, and then click Install.
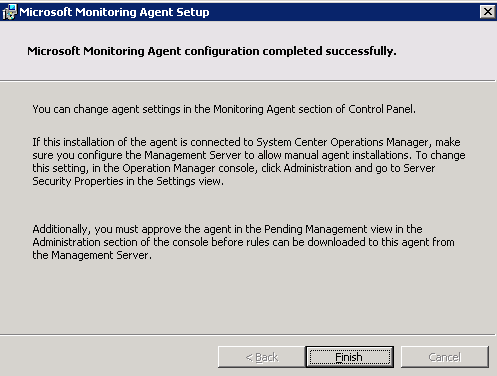
On the Configuration completed successfully page, click Finish.
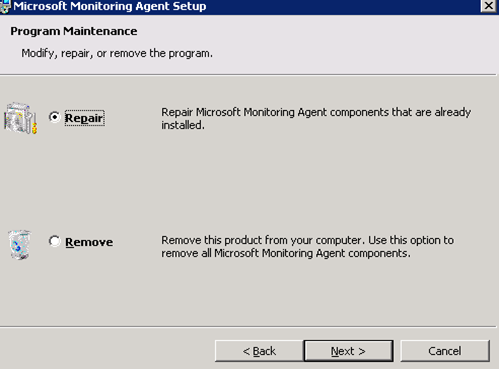
If you want to repair the program you can rerun the setup again.
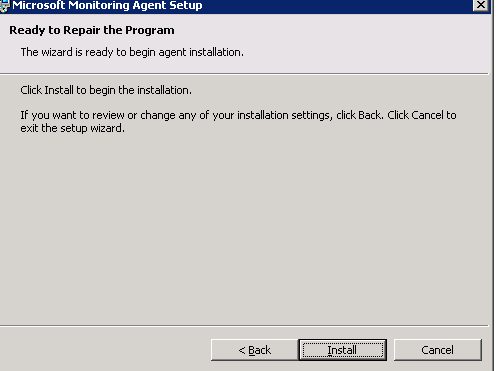
Choose the repair button and click next.
How to verify the agent connectivity?
You can easily verify whether the agents are communicating.
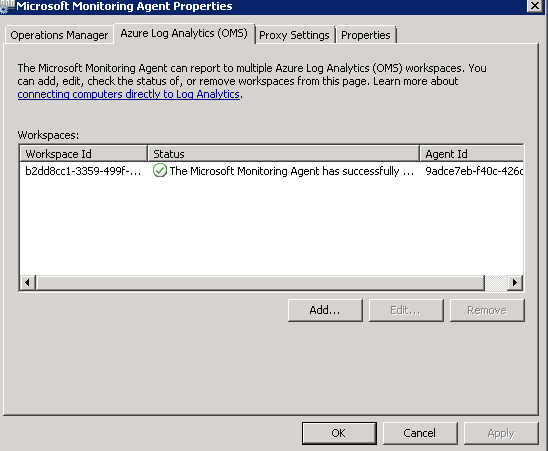
Please go to the windows control panel and open the Microsoft Monitoring agent.
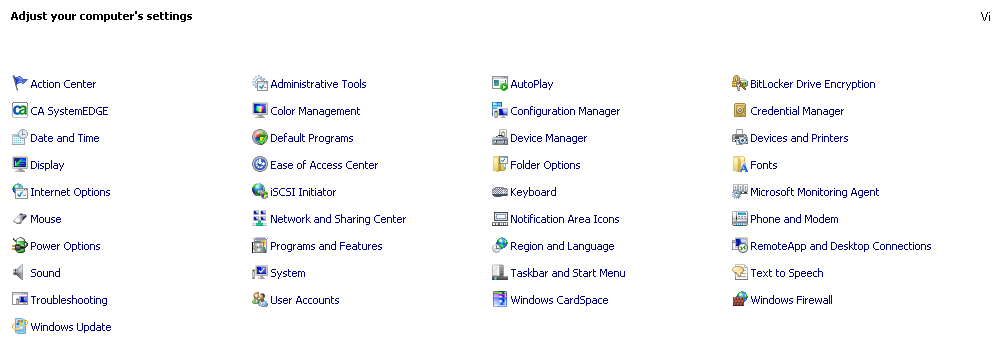
Click on the Azure Log Analytics Tab. In the Status column, you should see that the agent connected successfully to Log Analytics
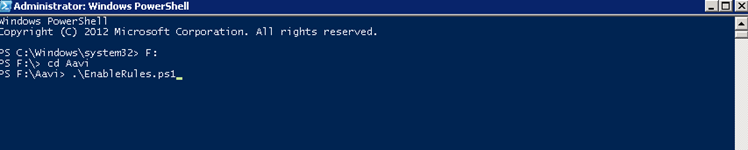
Now go to the Powershell in the agent computer and run the script which you have downloaded earlier

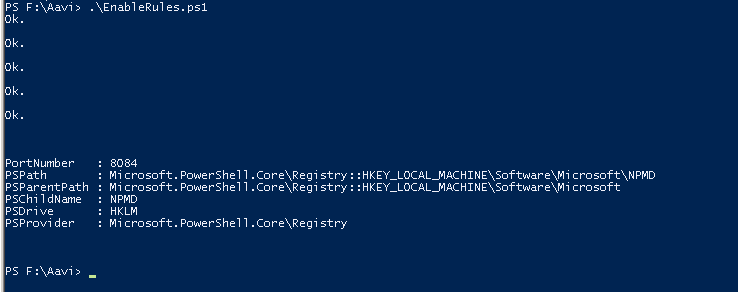
The below command will create the firewall rules in the windows firewall.
As you can see few rules are created.
The next step is to configure the rule in Network Security Group (NSG) and to continue with a bunch of other steps which I will discuss in my next post-Part II. For today that’s all that I have posted so far, I hope you will like this post and will be eagerly wait for the part II.
Thanks for your time and you have a great day ahead.

What to do when you need more public IP’s in your Azure Subscription
Azure VNET – A very basic guide available for download